Network attacks are becoming increasingly complex, targeted and dangerous. System administrators have to review enormous network event log files every day to monitor those threats. Security visualization systems allow administrators to perceive essential trends and patterns among all this data, in order to successfully detect and investigate intrusions. Optimizing the effectiveness of these visualizations is clearly important, but is there a way to accurately assess the performance of a visualization system?
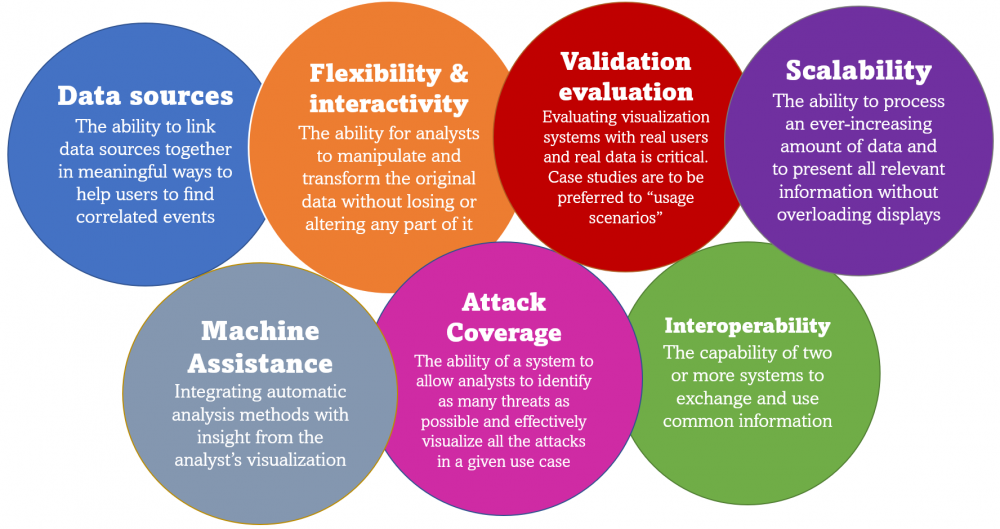
Sharafaldin et al. developed a new evaluation framework to facilitate the assessment and performance evaluation of security visualization systems. Building on Shiravi et al.’s previous review and categorization efforts, they provide an updated and improved classification of visualization systems and propose a new network attacks taxonomy. The authors also surveyed 26 network security visualization papers published between 2012 and 2018, assessing the systems they proposed according to their new evaluation framework.
The authors’ proposed taxonomy is based on the Common Attack Patterns and Enumeration (CAPEC) model, divided into categories of passive and active attacks. They classify each of the 26 recent papers and their visualization systems into 9 use cases: host/server monitoring, internal/external monitoring, attack patterns, routing behavior, intrusion detection systems (IDS) monitoring, configuration visualization, stenography visualization (depicting communication anomalies to discover hidden messages), proxy server monitoring and encrypted traffic monitoring.
The authors identified many issues by applying their evaluation framework to existing security visualization tools. Systems presented in papers are often hard to test and implement in a real-world setting because they usually lack detailed technical documentation. More than 80% of the surveyed systems used a single data source, which is typically insufficient. Importing and exporting data from visualization systems is also often difficult. Very few systems leverage big data frameworks, even though conventional log processing technologies have been shown to be inefficient. Visualization systems are too often developed and evaluated based on usability studies far removed from real users and real data. Another problem could be the lack of publicly accepted dataset benchmarks, allowing for the comparison of reported results.
These problems could lead the industry to believe that visualization is not useful for solving its challenges. This new evaluation framework can be used by individuals and organizations to choose the visualization system that best fits their needs. It could also lead to the improved design of visualizations by highlighting flaws within systems.
Current security event visualization systems could be improved in terms of their interaction with human capacities and use of big data analysis.
Financé par :  Hébergé par :
© 2019 SERENE-RISC, Tous droits réservés. Conditions d'utilisation